


�verv�gande mulet, Uppeh�ll")


Northern hemipshire temperature-anomalies & Global warming
Notice: Undefined variable: uahjson in /data/0/3/03409be0-f8b8-4188-99fb-c0241cf66d89/lokaltvader.se/public_html/klimat/clima.php on line 65
Notice: Use of undefined constant DATABY - assumed 'DATABY' in /data/0/3/03409be0-f8b8-4188-99fb-c0241cf66d89/lokaltvader.se/public_html/klimat/clima.php on line 103
Northern hemipshire temperature-anomalies from 4 different sources what at available on the net.
Noteble here are that every source use different timeframe as "normal" average and also that for how long time backvards data are available vary. Data are updated once a month.
UAH
Info:
Average: 1981-2000
Measured with NOAA-satellites.
Data from year: 1979
DATABY University of Alabama/National Space Science and Technology Center (NSSTC) .
Notice: Undefined variable: rssjson in /data/0/3/03409be0-f8b8-4188-99fb-c0241cf66d89/lokaltvader.se/public_html/klimat/clima.php on line 119
Notice: Use of undefined constant DATABY - assumed 'DATABY' in /data/0/3/03409be0-f8b8-4188-99fb-c0241cf66d89/lokaltvader.se/public_html/klimat/clima.php on line 154
RSS
Info:
Average: 1979-1998
Measured with NOAA-satellites
Data from year: 1979
DATABY Remote Sensing Systems/NASA .
Notice: Undefined variable: ncdcjson in /data/0/3/03409be0-f8b8-4188-99fb-c0241cf66d89/lokaltvader.se/public_html/klimat/clima.php on line 176
Notice: Use of undefined constant DATABY - assumed 'DATABY' in /data/0/3/03409be0-f8b8-4188-99fb-c0241cf66d89/lokaltvader.se/public_html/klimat/clima.php on line 211
NCDC
Info:
Average: 1901-2000
Surface data: Global Historical Climate Network (GHCN)
Ocean data: Extended reconstructed sea surface temperature (ERSST)
Data from year: 1880
DATABY NOAA/National Climatic Data Center (NCDC) .
Notice: Undefined variable: hadjson in /data/0/3/03409be0-f8b8-4188-99fb-c0241cf66d89/lokaltvader.se/public_html/klimat/clima.php on line 234
Notice: Use of undefined constant DATABY - assumed 'DATABY' in /data/0/3/03409be0-f8b8-4188-99fb-c0241cf66d89/lokaltvader.se/public_html/klimat/clima.php on line 269
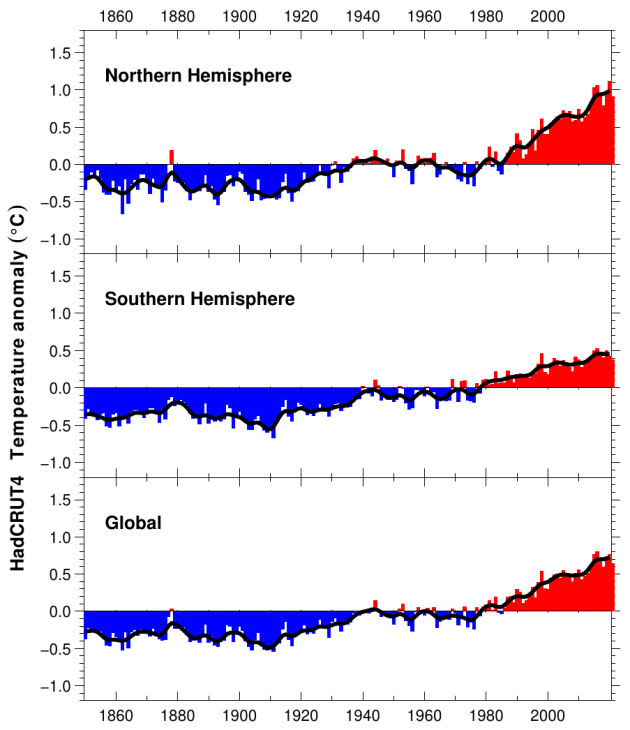
HadCRUT4
Info:
Average: 1961-1990
Measured with ca 3000 weatherstations, mainly in USA, South Canada, Europe and Japan.
Data from year: 1850
This is what ie. IPCC use.
DATABY UK MetOffice/Hadley Centre .
Disclaimer: This is not a declaration for or against global warming, just shows the differences between different data sources.